
Your VP of People just asked you to present the business case for the onboarding program you redesigned six months ago. You added a structured first week, a team introduction activity, daily manager check-ins, and a 30-day retrospective. You believe it's working. What you don't have is the data to prove it.
This is where most HR programs fail — not in design, but in measurement. If you didn't define what "working" looks like before you launched, you can't demonstrate success after the fact. And if you can't demonstrate success, you can't protect the budget, the manager time, or the program elements that are actually driving retention.
This guide covers the five metrics that measure onboarding effectiveness, plus the framework for reading them together and presenting the ROI case to leadership. Before the metrics: the model that connects them.
The Onboarding Measurement Stack
Most onboarding measurement programs track one number: 90-day retention rate. That's a necessary metric. It's not sufficient. Retention alone is a lagging indicator — by the time you see a retention problem, the departure decision was made weeks ago. The Onboarding Measurement Stack adds leading indicators that give you enough warning to intervene:
Layer 1 (Lagging): 90-day retention rate and time-to-productivity — tells you how the program performed overall for a cohort.
Layer 2 (Leading): 30-day engagement score, especially "I feel connected to my team" — tells you which current new hires are at departure risk before they've made the decision.
Layer 3 (Enabling): Onboarding satisfaction and manager readiness scores — tells you which parts of your program are working and which parts exist on paper but not in practice.
The reason most onboarding measurement stops at Layer 1 is that Layer 2 and 3 require more operational effort: a pulse survey at day 30, a retrospective conversation, a separate survey sent to managers. That effort is where the program actually improves. Layer 1 data tells you whether something is broken. Layers 2 and 3 tell you what to fix.
Metric 1: 90-Day Retention Rate
The baseline. Of every N new hires who started in a given quarter, how many are still at the company at day 90?
Track it per cohort (Q1 hires, Q2 hires), not as a rolling average. Cohort tracking reveals seasonal or role-specific patterns that rolling averages obscure. A before-and-after comparison — retention by cohort before your program launched versus after — is the cleanest attribution argument even without a control group.
Benchmarks from the research: structured onboarding programs achieve 85–90% 90-day retention according to SHRM data. Below 80% indicates structural gaps. Above 90% means you're outperforming the benchmark for well-run programs. SHRM estimates replacement cost at six to nine months of the departing employee's salary — for a mid-level hire at $80,000 annually, each retained employee saves $40,000–$60,000.
Metric 2: New Hire Engagement Score at Day 30
The most valuable leading indicator in the stack. A five-question pulse survey sent at the end of month one, before the departure decision has been made.
The questions that predict retention most reliably:
- I feel connected to my team. (1–5 scale)
- I know what success looks like in my role right now. (1–5 scale)
- My manager has been available and supportive this month. (1–5 scale)
- I can see myself still working here in six months. (1–5 scale)
- How would you rate your first month overall? (1–10 scale)
The question to watch most closely: "I feel connected to my team." Gallup research shows only 12% of employees strongly agree their company does a great job onboarding. The gap is almost always social — new hires don't feel connected to their team by day 30. A score below 3.5 on this question is a warning signal that departure risk is elevated. A score above 4.2 indicates your social layer is working.
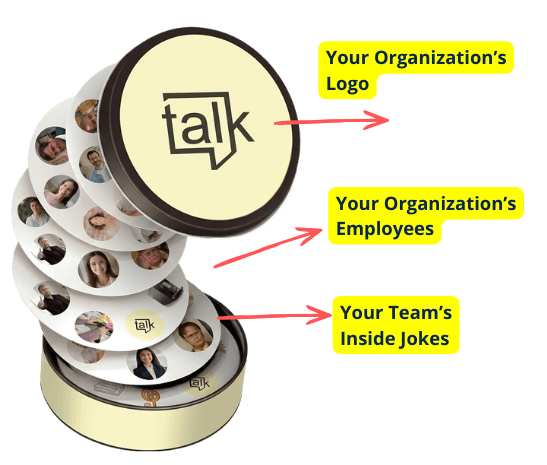
The team connection score is also the metric most directly moved by social introduction activities at onboarding. If your historical scores on this question are low, the highest-leverage intervention is adding a structured team introduction activity — one that encodes names and faces through active engagement before the first meeting, not after two weeks of passive observation. The employee onboarding game is built specifically to move this metric.
Metric 3: Time-to-Productivity
How long does it take a new hire to contribute at the expected level for their role? This speaks directly to the business case for onboarding quality: not just whether people stay, but how quickly they're producing value.
Measurement: ask managers to rate each new hire's productivity on a 1–5 scale at day 30, 60, and 90. Track the distribution across cohorts, not individual scores. For roles with defined output metrics (sales quota attainment, engineering commits, tickets closed), use objective data instead of manager ratings.
What good looks like: Gallup's research on new hire productivity suggests an average of 8 months to full productivity across all roles. Well-designed onboarding programs compress this timeline by reducing time spent in confusion and ambiguity. A program that gets new hires to "3 out of 5" productivity by day 60 instead of day 90 is delivering 30 days of additional output per hire — multiplied across your annual hire count, that's a measurable business impact.
The specific onboarding element most linked to faster time-to-productivity: clear 30-day expectations delivered in writing before or on day one. New hires with written 30-day expectations spend less time in the "am I doing the right things?" anxiety loop and more time actually contributing.
Metric 4: Onboarding Satisfaction Score (Day-30 Retrospective)
A single question asked at the 30-day retrospective conversation: "How well did our onboarding program prepare you for your first month?" On a 1–10 scale, with a required open-ended comment.
This metric does two things. First, it gives you a trended score across cohorts — you can see whether the program is improving over time. Second, the qualitative comments are where you find the specific gaps to fix. The pattern in the first 10 comments will tell you more about what's broken than any amount of internal process documentation. Items mentioned in 3 of 10 responses are worth addressing. Items mentioned in 7 of 10 are structural problems.
Run the retrospective in person (or via video for remote hires). A survey form alone produces shorter, less candid answers than a conversation. The question "What do you wish you'd known on day one?" generates the most useful responses of any retrospective question — and the answers to it are the inputs to your next program update.
Metric 5: Manager Readiness Score
The metric most companies skip and the one that most often explains variance in all the others. How prepared did managers say they felt to onboard their new hire?
The onboarding program HR designs is executed by line managers. If managers don't know what they're expected to do in week one, don't have a 30-day expectations template, and don't understand that daily check-ins are a program requirement rather than a suggestion — your program exists on paper and not in practice. Gallup found that when managers take an active role in onboarding, new hires are 3.4 times more likely to say the process was successful. Manager readiness score measures whether your managers are equipped to play that role.
Survey format: sent to managers at day 30 alongside the new hire pulse survey. Three questions: "I felt prepared to lead this new hire's onboarding" (1–5), "The onboarding materials gave me what I needed" (1–5), "What would have helped me more?"
Low scores on this metric are a training problem, not an attitude problem. The fix: a manager-specific onboarding guide — one page — that tells each manager exactly what to do in week one, which meetings to schedule, what language to use in the day-30 expectations conversation, and what the daily check-in is supposed to sound like.
Reading the Stack Together
| If you see this... | The likely gap is... | The fix is... |
|---|---|---|
| Low 90-day retention + low 30-day team connection score | Social layer (no structured intro activity) | Add team intro game or activity to day one; pre-board with team photo guide |
| Low 90-day retention + low "I know what success looks like" score | Expectations layer (no 30-day expectations doc) | Manager writes and delivers 30-day expectations before or on day one |
| Low 90-day retention + low manager readiness score | Manager execution (program exists on paper) | One-page manager onboarding guide; manager briefing session before each cohort |
| Acceptable retention + low time-to-productivity | Role clarity (staying but not contributing) | Clearer first assignments with explicit deliverables; earlier cross-functional introductions |
| Good 30-day scores + high 90-day departures | Weeks 2–4 drop-off (program ends too early) | Extend check-ins through day 30; add 30-day retrospective; continue buddy relationship |
Presenting the ROI Case to Leadership
The calculation is straightforward once you have cohort retention data. Use SHRM's replacement cost estimate of six to nine months of salary as your baseline.
Example: your company hires 40 people per year at an average salary of $80,000. Before your structured onboarding program, 90-day retention was 74% (about 10 early departures per year). After implementation, 90-day retention is 87% (about 5 early departures per year). Five additional retained employees per year, at $40,000 replacement cost each (six months of salary), is $200,000 in avoided cost. If the onboarding program costs $25,000 per year to run — staff time, materials, the team intro game, the 30-day survey tool — the ROI is 8x in year one. That calculation doesn't include the productivity gains from faster time-to-contribution, which add another layer of business impact.
If you don't yet have before-and-after data, use SHRM benchmarks as your baseline (85% vs. your current rate) and build a projected ROI model before the program launches. Then confirm it with actuals at the one-year mark.
When Measurement Is Not Enough
Metrics tell you what is happening. They don't always tell you why. A 30-day team connection score of 2.9 tells you the social layer is failing — it doesn't tell you whether the failure is the absence of a structured intro activity, a manager who delegated day one to HR, or a team that is too busy in their first week to make time for the new hire. The retrospective conversation is where you get the why. The metrics point you to the right question to ask.
Also: if your 90-day retention problem is driven by compensation mismatches or role misrepresentation in the interview process, improving your onboarding program will not fix it. Run exit interviews alongside your onboarding metrics and separate "job not what I expected" departures from "onboarding failed me" departures. They require different solutions.
Practical Scenario: Vantage Research's Measurement Turnaround
Vantage Research is an 80-person market research firm that hired 18–22 researchers per year. Their onboarding program was well-designed on paper — a first-week orientation, a buddy assignment, a 90-day plan. 90-day retention was 71%. When they started collecting the 30-day pulse survey, they found their team connection score was consistently 2.7 out of 5. Researchers were arriving at day 30 not knowing their teammates' names. The fix: they added a custom matching game built from team headshots to every welcome kit, shipped to new hires' homes before the start date, and restructured day one to open with a 20-minute game session. Within two cohort cycles, the team connection score moved to 4.1 and 90-day retention climbed to 86%. The People Ops lead reported to the executive team using before-and-after cohort data — the numbers made the case without additional context.
Frequently Asked Questions
What are the most important onboarding metrics to track?
Five: 90-day retention rate (lagging, overall success), new hire 30-day engagement score — especially team connection (leading, early warning), time-to-productivity via manager assessment (business impact), onboarding satisfaction at the day-30 retrospective (program quality), and manager readiness score (execution quality). The team connection score at day 30 is the most actionable: it reveals departure risk while you still have time to intervene.
How do you measure time-to-productivity for a new hire?
Ask managers to rate each new hire's productivity on a 1–5 scale at day 30, 60, and 90. Track distributions across cohorts. For sales, engineering, or other roles with defined output metrics, use objective data instead. The distribution matters more than individual scores — a well-run onboarding program shifts the entire distribution toward "3 out of 5 by day 60" rather than raising one person's ceiling.
When should you collect onboarding feedback from new hires?
Day 30 (end of formal onboarding, most actionable), day 60 (integration check — specifically team connection), and day 90 (full early-tenure review). Day 30 feedback is the most valuable for program improvement: problems are recent enough to be described specifically and even 5 responses reveal patterns. Don't wait until day 90 to collect feedback — by then you've run three more cohorts through the same broken program.
How do you benchmark your onboarding metrics?
Key benchmarks: SHRM data shows structured programs achieve 85–90% 90-day retention (below 80% indicates structural gaps). Gallup: only 12% of employees strongly agree their company does a great job onboarding. Time-to-full-productivity averages 8 months across all roles. A 30-day team connection score below 3.5 out of 5 indicates your social layer is underperforming. Use these as your baseline; improve against your own cohort history from there.
How do you present onboarding ROI to leadership?
Convert retention improvement to dollars using SHRM's six-to-nine-months-of-salary replacement cost estimate. If hiring 40 people per year at $80,000 average salary and structured onboarding improves 90-day retention by 12 percentage points, that's roughly 5 additional retained employees per year, at $40,000 replacement cost each — $200,000 in avoided cost. Compare that to program cost. For most companies with 40+ annual hires, the ROI is positive in year one, before productivity gains are counted.